Zenoss' zenperfsnmp daemon generates a lot of events. In most cases it is the leading source of events by a significant margin.
Depending on the monitoring templates in place and the number of devices being monitored by Zenoss, zenperfsnmp may be raising thousands of events during each cycle. Before being processed by the event engine these events are held in a queue, the length of which is determined by the config parameter maxqueuelen.
If the queue of events exceeds maxqueuelen, new events are dropped indiscriminately. This is obviously undesirable, even if it happens only occasionally. But when your zenperfsnmp event queue looks like this...
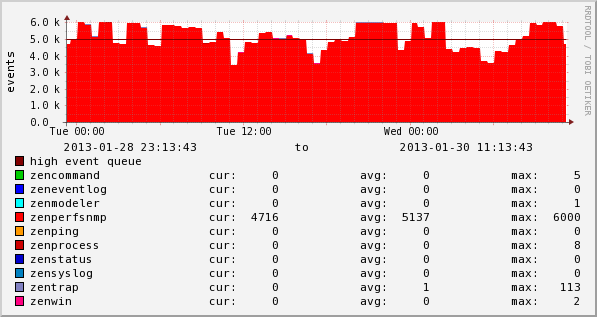
...you're likely to be consistently dropping events.
Dropped events are accompanied by "WARNING zen.zenprocess: Queue exceeded maximum length" in the zenperfsnmp log. This problem indicates a bottleneck in the processing of the event queue and is discussed on the Zenoss forums here and here.
Approaching the problem from one angle, you can attempt to increase your capacity for event processing by adding zenworkers. Or you can increase your maxqueuelen to cope with spikes, however that won't help when zenperfsnmp is producing a sustained volume of events.
But it may also be feasible to solve the problem at the source, by reducing the number of events that zenperfsnmp generates in the first place. In a long-standing system, many monitoring templates are likely to have been set up over time and it's all too easy to add an extra OID to a widely-used SNMP template without realising the implications for the eventing system.
Furthermore, it is not always feasible to just look at the event console to determine the events being raised. Events transforms may be moving events to different classes, suppressing them or deleting them altogether. Even if an event is dropped immediately by an event transform, it has still spent time in the event queue.
The solution is to look at the zenperfsnmp log to see exactly what events are being raised. This is going to require a lot of additional logging, so first increase the log size upper limit in /opt/zenoss/etc/zenperfsnmp.conf:
maxlogsize 1024000
Then restart the daemon, enabling debug:
zenperfsnmp -v10
The next time zenperfsnmp cycles, you will now see 'Queueing Event' log messages each time an event is queued by zenperfsnmp.
All well and good you might say, but with thousands of events being raised each cycle how are we to identify the Event Classes where most of the volume is occurring?
Fortunately there's an easy way. Simply run this python script over your newly-verbose log file:
1 2 3 4 5 6 7 8 9 10 11 12 13 14 15 16 17 18 19 20 21 22 23 24 25 | |
The output will show you the count of event raised for each event class:
zenoss@myzenserver$ ./zp_count.py
/Status/Interface/Duplicity: 42934
/Status/IpInterface: 31233
/Perf/Snmp: 7362
/Change/Set/Status: 6134
/Perf/Filesystem: 710
/Perf/LogicalDisk/RAID: 448
/Perf/Interface: 288
/Status/Snmp: 133
/Perf/Memory: 127
/Perf/Interface/Discards: 83
/Perf/Load: 73
/Perf/CPU: 66
/Heartbeat: 31
/Perf/Interface/Collisions: 30
/Status/Zenoss/EventQueue: 22
The longer you wait before running the script, the more insight it will give you into the events zenperfsnmp is producing. In this case, we should really investigate the Monitoring Templates producing events with classes /Status/Interface/Duplicity and /Status/IpInterface.
If you can reduce unnecessary events, you won't have to worry about increasing your capacity to deal with them.